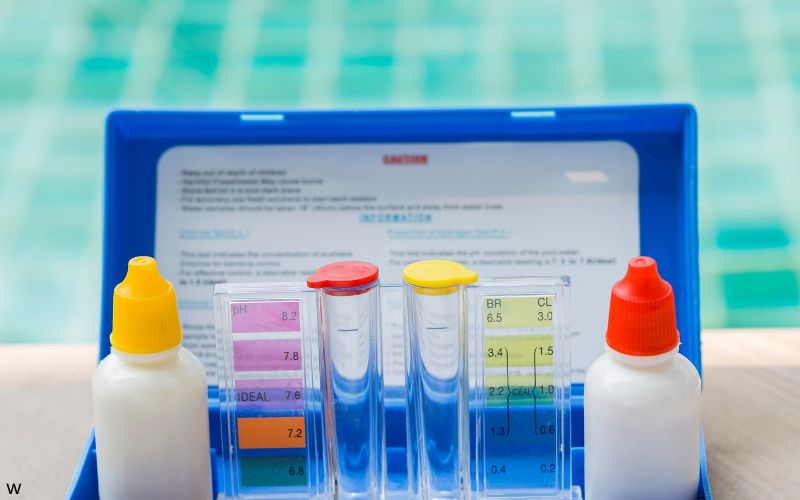
San Antonio Water Quality at a Glance
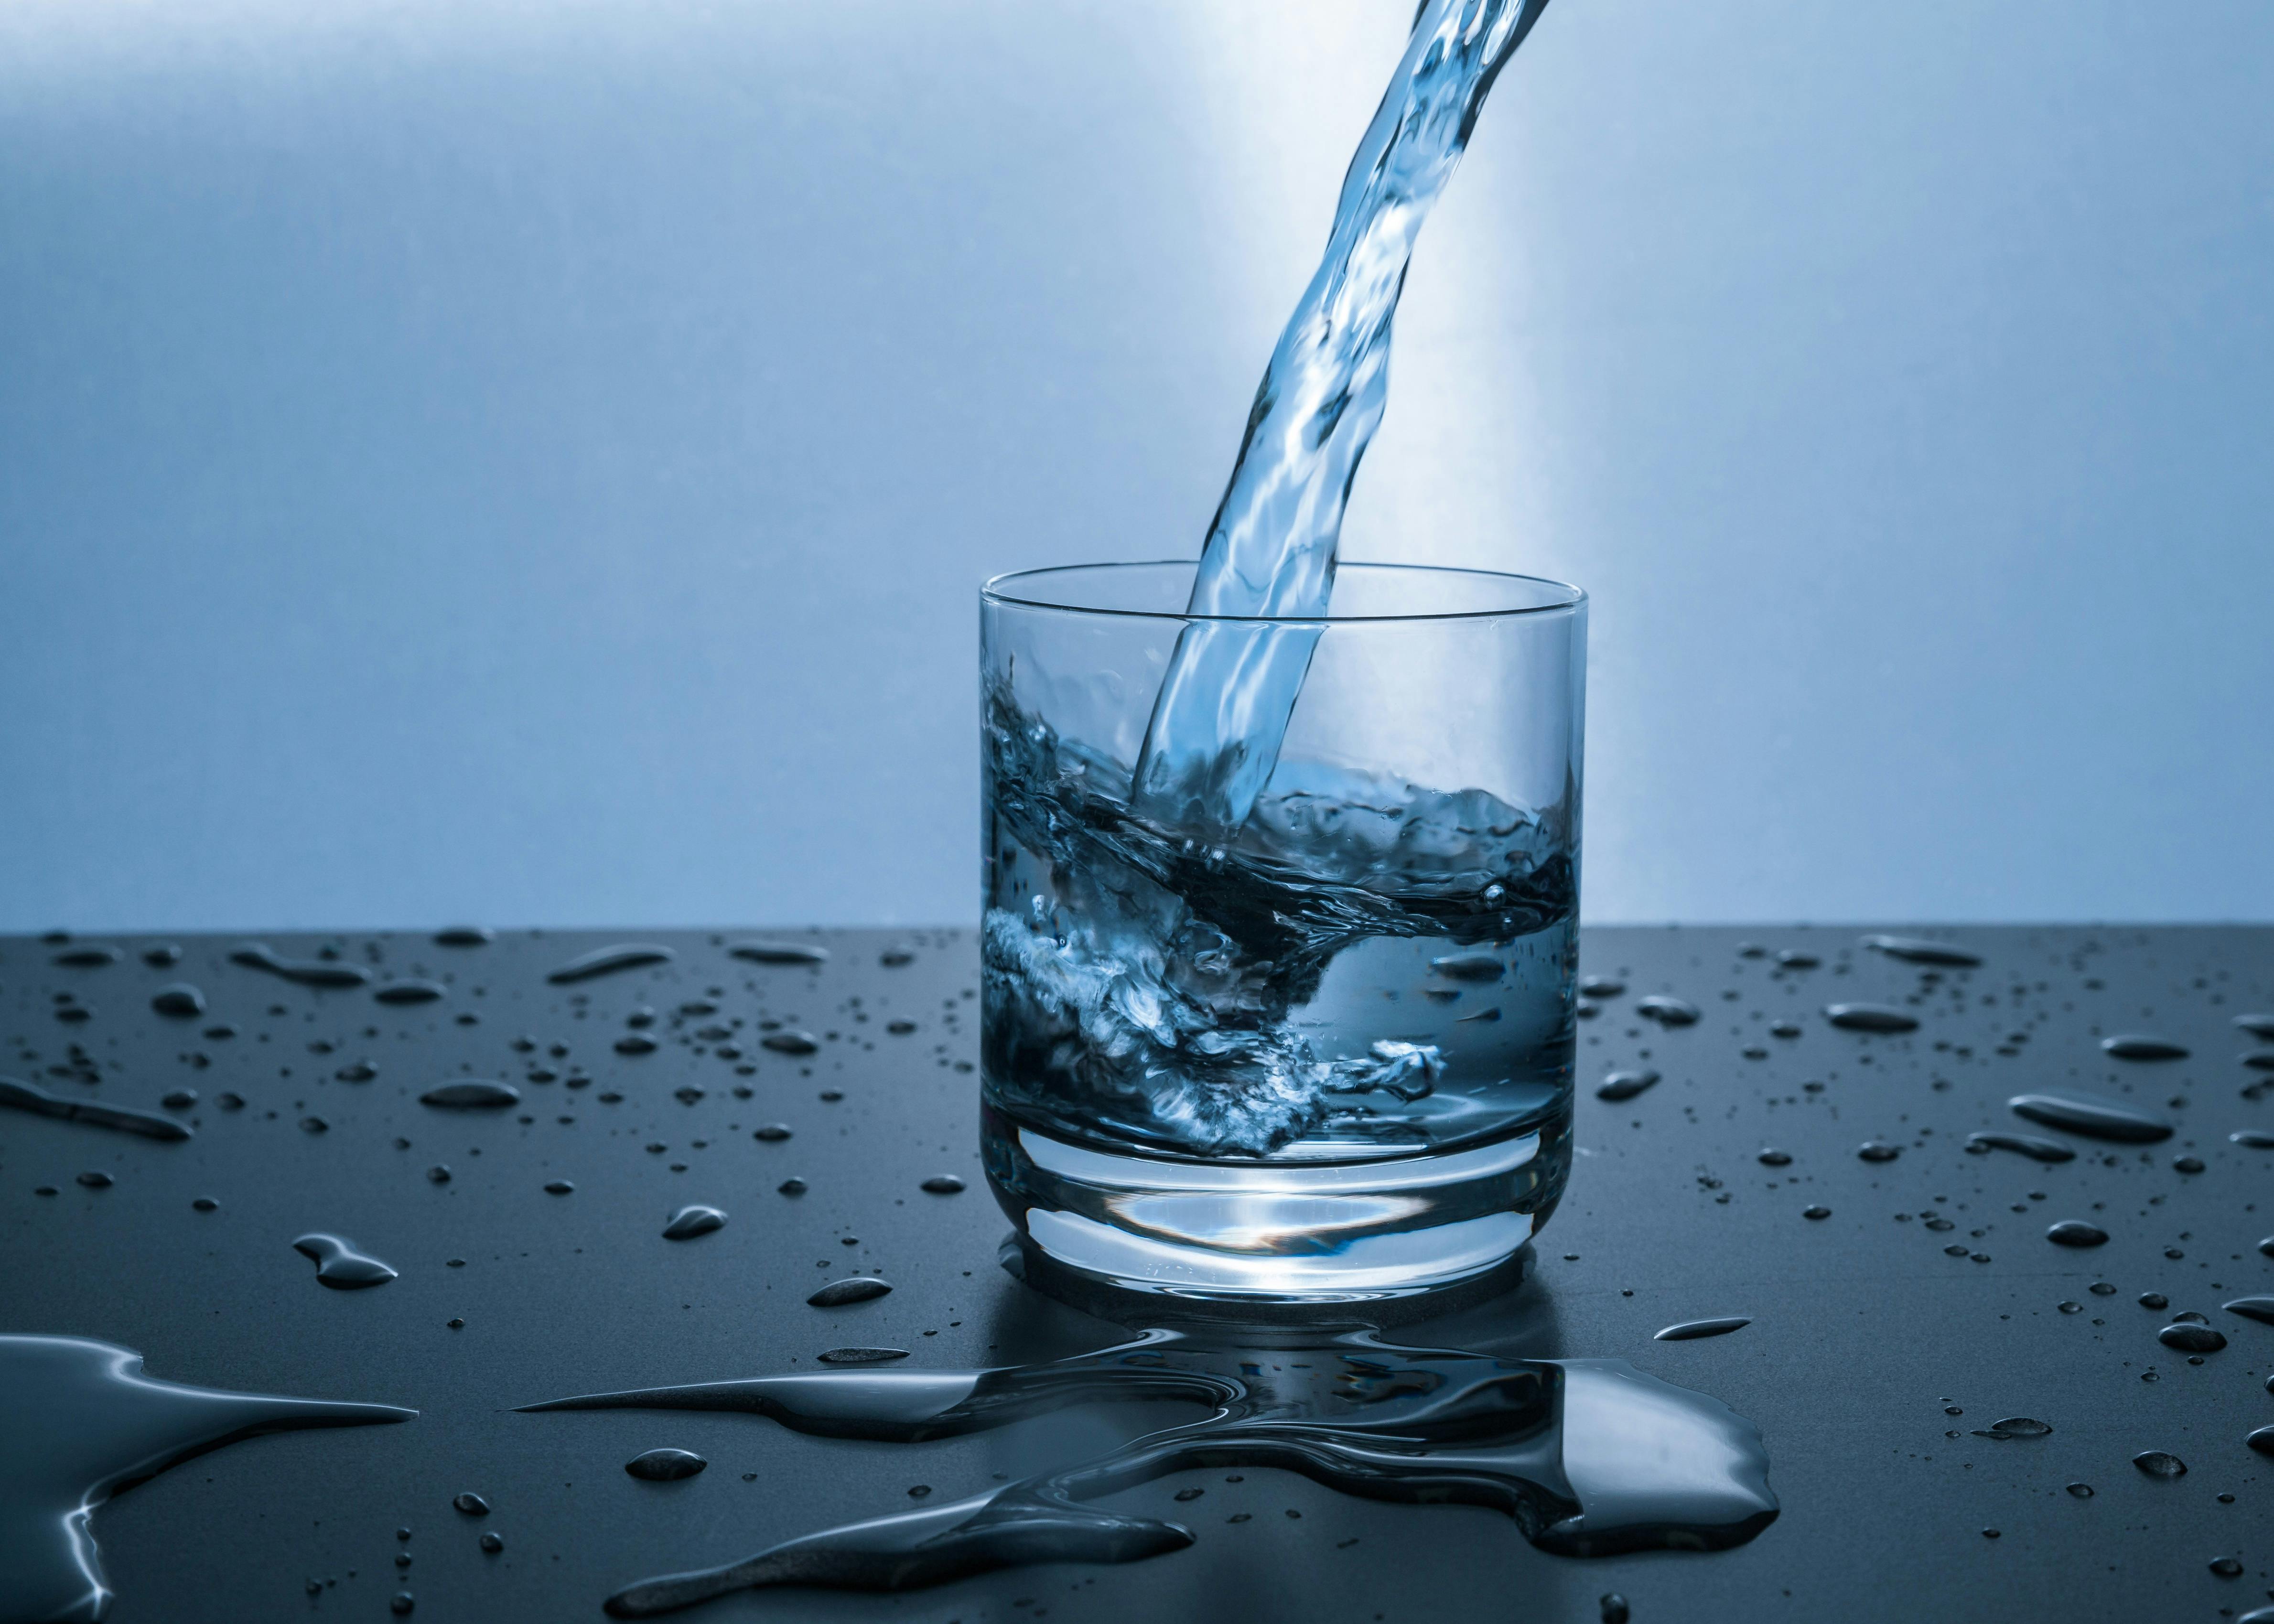
Is San Antonio Water Safe to Drink?
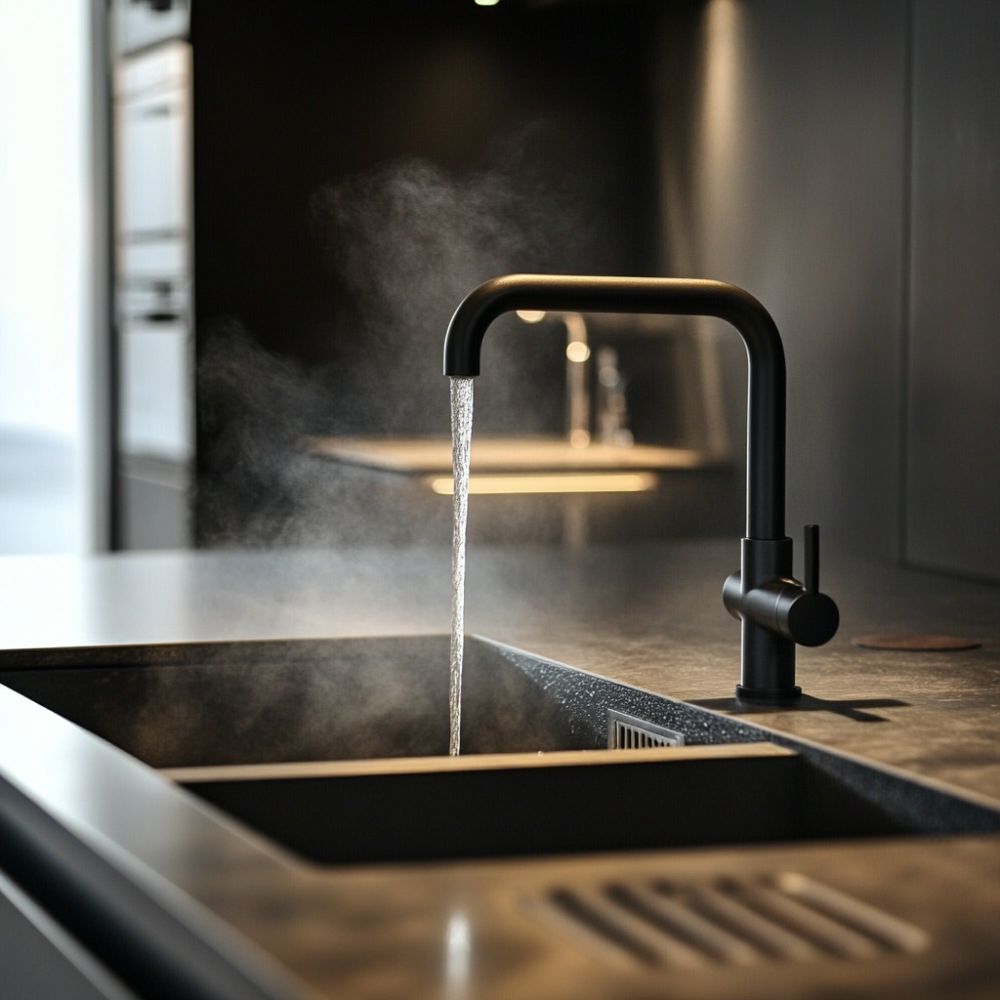
Generally Safe — Among the Best in Texas — San Antonio’s water received no violations in 2024 and draws from multiple protected aquifers, providing some of the purest groundwater in the nation. Lead testing improved significantly to a 90th percentile of just 1.6 ppb (down from 3.25 ppb). PFAS exposure is minimal — only trace PFBS detected at 3.8 ppt, well below the EPA’s 4 ppt MCL. The main concerns flagged by EWG are disinfection byproducts (TTHMs at 152x EWG guideline) and chromium-6 (6.8x EWG guideline). All 15 contaminants exceeding EWG guidelines remain within federal legal limits. See our water filter guide and Texas statewide water quality overview for more context.
⚠️ Key Concerns for San Antonio Residents in 2026
- Disinfection Byproducts (TTHMs & HAAs): TTHMs averaged 22.9 ppb (152x EWG guideline; legal limit 80 ppb); HAA5s at 5.76 ppb (58x EWG guideline). Higher bromine content from aquifer water produces more brominated byproducts than typical surface-water systems.
- Chromium-6 (Hexavalent): Detected at 0.136 ppb — 6.8x EWG’s health guideline of 0.02 ppb. No federal MCL exists for chromium-6 specifically. Linked to cancer risk with long-term exposure.
- Nitrate: Detected at 1.42 ppm — 10x EWG’s health guideline of 0.14 ppm; well below the federal limit of 10 ppm. Sourced from agricultural runoff and natural deposits in the aquifer system.
- Radium (combined 226/228): At 0.34 pCi/L — 6.8x EWG’s health guideline; within the EPA legal limit of 5 pCi/L. Naturally occurring from geological formations in the Edwards Aquifer system.
- Lead Service Lines: SAWS’s Project Lead programme offers free service line inspections for homes built before 1989. Although lead at tap has improved dramatically, older plumbing still warrants attention — visit saws.org/lead.
Read the full report below for detailed analysis, city-specific data, and actionable recommendations for San Antonio residents.
advertisment – report continues below
Your water passed the test.
Legal isn’t the same as safe.
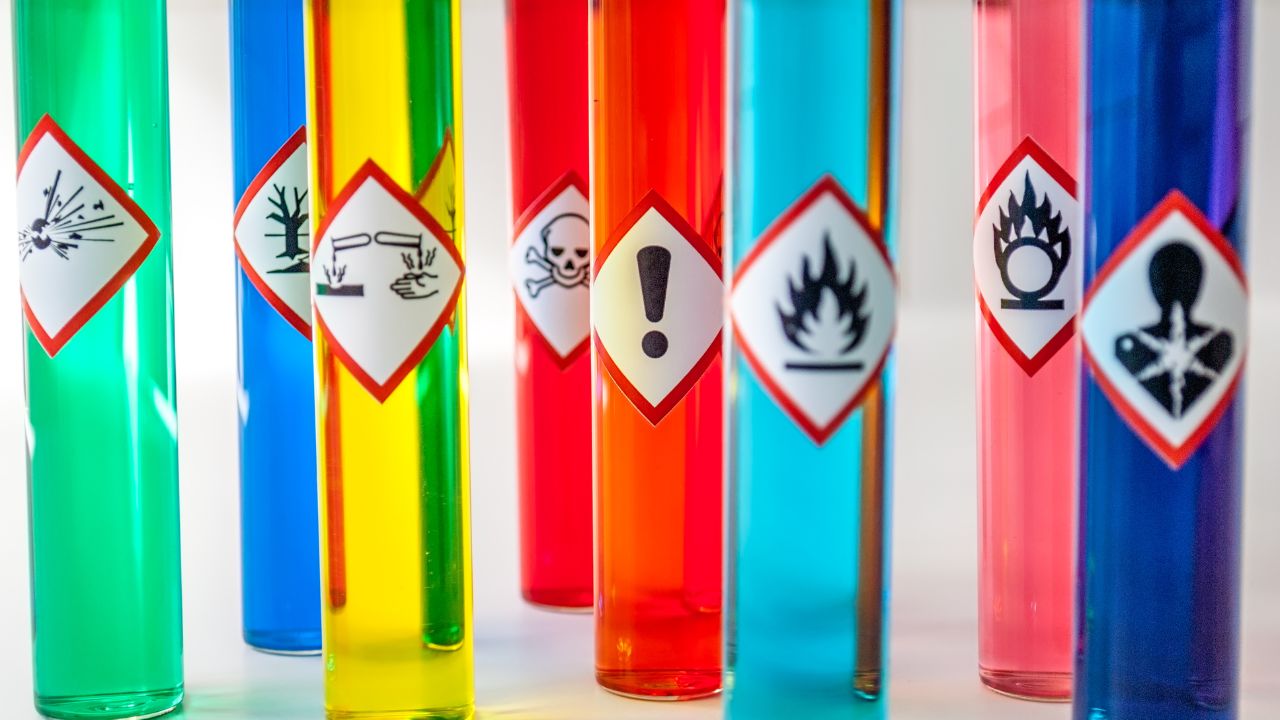
Regulated contaminants like PFAS, chromium-6, and disinfection byproducts can sit inside the legal limit and still carry long-term health risks. Passing isn’t the same as clean.
✅ Removes PFAS, lead & chromium-6 — the contaminants most flagged even in passing city reports
✅ NSF/ANSI 42, 58 & 372 certified — independently tested, not just manufacturer claims
✅ Installs in 30 minutes, no plumber — fills a glass in 8 seconds, smart LED filter monitor
Renting or can’t drill? The Waterdrop K19 Countertop RO — plug in, fill the tank, done. No installation, no drilling, no plumber.
Advertisement — this page contains affiliate links. If you buy through these links, we may earn a commission at no extra cost to you.

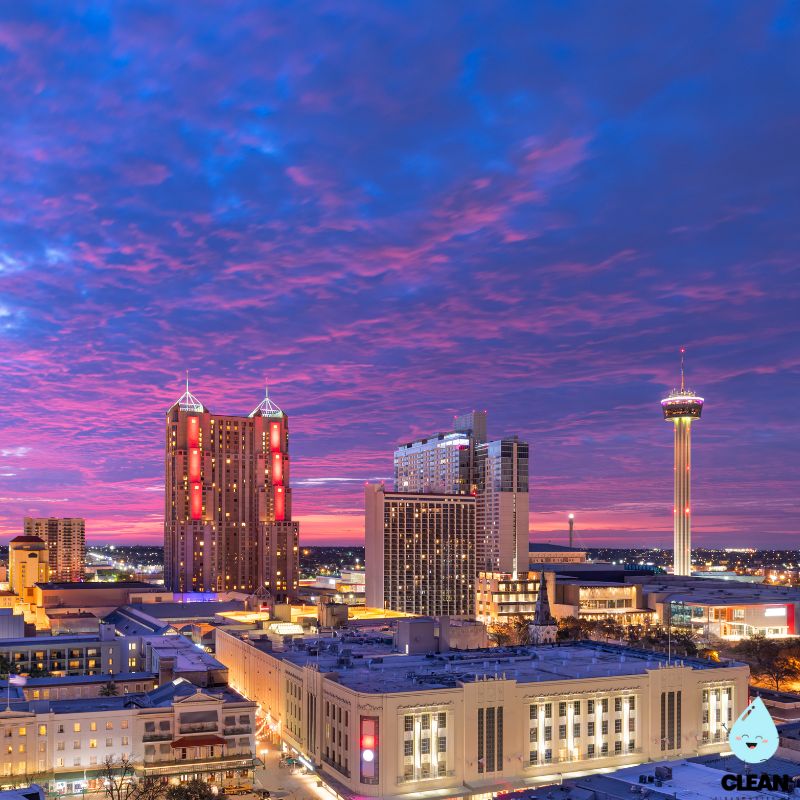
San Antonio — Texas — Water Quality Report 2026: PFAS Testing, Edwards Aquifer & Safety Across Your City
San Antonio, one of the nation’s largest cities, serves approximately two million people through the San Antonio Water System (SAWS), widely regarded as one of the most innovative municipal utilities in the United States. The city’s water infrastructure includes nearly 9,000 miles of water mains, eight water recycling centres, and multiple treatment facilities, delivering approximately 136.5 million gallons daily.
Unlike many cities that rely primarily on surface water, SAWS draws from multiple aquifer systems — the Edwards, Carrizo, Simsboro, Trinity, and Wilcox aquifers — supplemented by surface water from Canyon Lake and purchased water from regional authorities including Canyon Regional Water Authority, GBRA Western Canyon, and Vista Ridge LLC. This aquifer diversity provides outstanding baseline water quality that typically requires minimal treatment. The 2025 Water Quality Report (covering 2024 data) confirms no violations and excellent regulatory compliance. Check our live boil water notices tracker for any active advisories in the San Antonio area, and our water alert news feed for the latest updates.
San Antonio Water Quality: Current Status (2025–2026)
Latest Testing Results (2024 Data)
- Lead & Copper: The 2024 testing period showed a 90th percentile lead level of just 1.6 ppb — a marked improvement on the previously reported 3.25 ppb and well below the EPA action level of 15 ppb. Zero sites exceeded the action level. Copper was at 0.187 ppm, also well below its 1.3 ppm limit. SAWS’s Project Lead programme offers free service line inspections for homes built before 1989 to help complete the public inventory — visit saws.org/lead.
- PFAS (UCMR5, 2024): UCMR5 monitoring detected PFBS (Perfluorobutanesulfonic acid) at an average of 0.0038 ppb (3.8 ppt) — at the minimum reporting level and below the EPA’s 4 ppt MCL. Multiple other PFAS were not detected. This is one of the most favourable PFAS profiles of any large US city, reflecting the protected nature of the Edwards Aquifer system. For PFAS context see our water quality testing guide.
- Regulatory Compliance: The SAWS main system received no violations in 2024. Bacteria monitoring across 390 sites found one E. coli positive out of thousands of samples — no MCL violation was triggered. Turbidity peaked at 0.08 NTU, well within the 1 NTU limit, with 100% of monthly samples meeting the 0.3 NTU treatment technique requirement.
Multi-Aquifer Excellence
- Edwards Aquifer (Primary Source): The Edwards Aquifer, supplying the majority of SAWS’s water, is one of the most productive aquifer systems in the world. Water is naturally filtered through limestone over thousands of years, removing contaminants and providing excellent baseline quality. Strict recharge zone regulations and a comprehensive watershed management programme protect long-term quality.
- Carrizo-Wilcox Aquifer System: The Carrizo, Simsboro, and Wilcox aquifers provide supplementary groundwater supply, particularly important as Edwards Aquifer levels respond to seasonal recharge. These deeper aquifers provide additional supply resilience during drought years.
- Surface Water & Purchased Supply: Canyon Lake surface water and purchased supplies from regional authorities (Canyon Regional Water Authority, GBRA Western Canyon, Vista Ridge LLC, Schertz-Seguin Local Government Corporation, and others) supplement aquifer supply during peak demand. Surface water sources show higher TTHMs — Vista Ridge supply showed TTHMs of 47 ppb in 2024 compared to 33 ppb for the main system.
Disinfection Byproducts: The Primary EWG Concern
- Total Trihalomethanes (TTHMs): Averaged 22.9 ppb in the main system (range 0–52.9 ppb) — within the EPA legal limit of 80 ppb but 152x above EWG’s health guideline of 0.15 ppb. San Antonio’s aquifer water is naturally higher in bromide than many systems, leading to elevated formation of brominated disinfection byproducts (bromoform at 2.95 ppb, dibromochloromethane at 5.55 ppb) when chlorinated.
- Haloacetic Acids (HAA5s & HAA9s): HAA5s averaged 5.76 ppb (58x EWG guideline; legal limit 60 ppb); HAA9s at 9.67 ppb (161x EWG guideline). Key components include dibromoacetic acid (2.41 ppb, 80x EWG) and bromochloroacetic acid (2.12 ppb, 106x EWG) — both elevated due to the naturally high bromide content of the source water.
- Why This Occurs: Bromide occurs naturally in the Edwards Aquifer geology. When chlorine is used to disinfect, it reacts with bromide to form brominated disinfection byproducts at higher rates than in typical surface water systems. SAWS levels remain within all EPA limits but are higher relative to EWG’s stricter health-based benchmarks.
Water Sustainability Leadership & Infrastructure
- World-Class Recycled Water System: SAWS operates one of the largest direct recycled water systems in the world, producing over 50 million gallons daily of ultra-pure recycled water through advanced membrane bioreactor and reverse osmosis technology. This helps preserve pristine aquifer water for drinking while meeting non-potable demand.
- Vision2040 Water Plan: SAWS’s long-term sustainability plan aims to achieve water neutrality — meaning all future growth will be supplied through recycled water, conservation, and alternative supplies without increasing raw aquifer withdrawals. Per capita water use has fallen by over 40% since 1990.
- Smart Infrastructure: SAWS has deployed over 600,000 smart meters with real-time leak detection. Despite this, the 2024 water loss audit reported a combined total of approximately 19.2 billion gallons lost system-wide through main breaks, leaks, metering inaccuracies, and other causes — an ongoing challenge for a large, ageing distribution network.
- Project Lead: SAWS is actively building its lead service line inventory as required under the EPA’s updated Lead and Copper Rule. Free inspections are available for eligible customers (homes built before 1989 with unknown service line material) — this is a proactive step that distinguishes SAWS from many peer utilities. For independent testing options see our water quality testing guide.
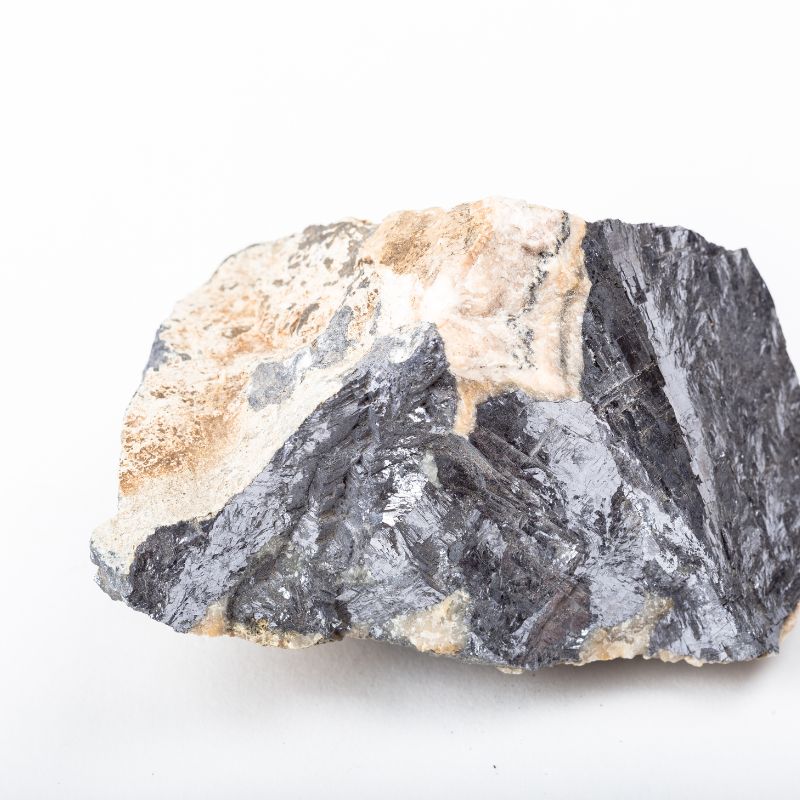
Radioactive Contaminants: A Natural Aquifer Characteristic
San Antonio’s aquifer-sourced water naturally contains low levels of radioactive minerals from geological deposits. Combined radium 226/228 was detected at 1.82 pCi/L — below the EPA legal limit of 5 pCi/L but 6.8x above EWG’s health guideline of 0.05 pCi/L. Uranium was detected at 1.7 µg/L (well below the 30 µg/L legal limit). Beta/photon emitters at 5.5 pCi/L remain well below the EPA’s concern level of 50 pCi/L. These levels are characteristic of limestone aquifer systems and are not a regulatory concern, though EWG’s more stringent guidelines flag them. For broader context on Texas water quality compare with our Texas state overview and nearby cities including Austin, Houston, and Dallas. If you’re weighing filtration options, our water filter solutions page includes recommendations for San Antonio’s contaminant profile.
Recommendations for San Antonio Residents
Consider Filtration for Disinfection Byproducts
San Antonio’s main concern is disinfection byproducts elevated by the natural bromide content of aquifer water. An activated carbon or reverse osmosis filter addresses TTHMs, HAAs, and chromium-6. See our water filter solutions guide for NSF-certified options matched to San Antonio’s contaminant profile. Disclosure: We may earn a commission on qualifying purchases.
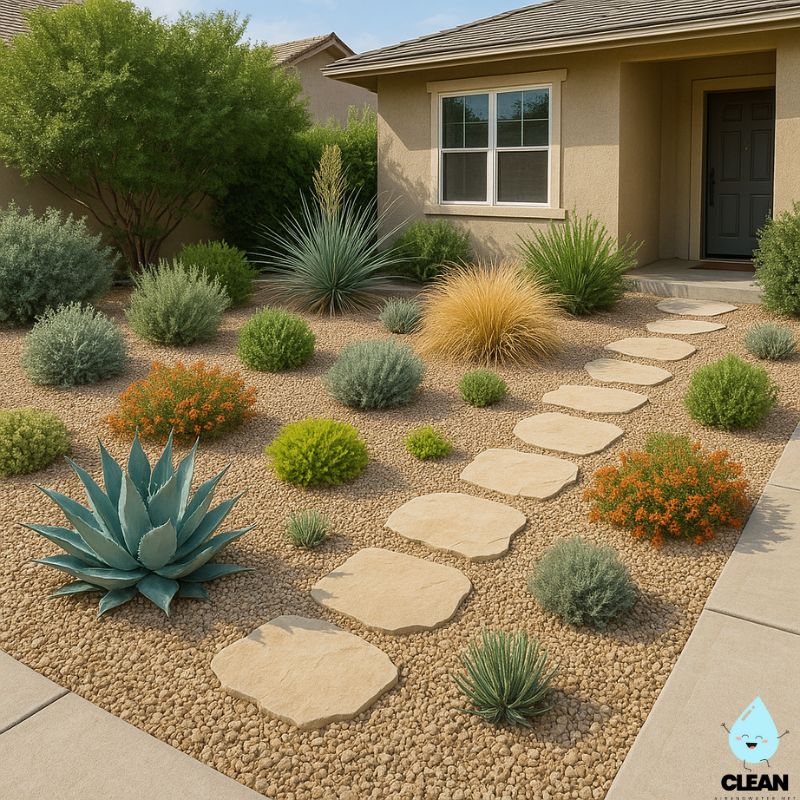
Conserve Water & Use Rebates
Follow SAWS’s watering schedule (twice weekly, based on your address), water only before 10 AM or after 8 PM, and consider xeriscaping with native plants. Take advantage of SAWS rebates for efficient fixtures, smart irrigation controllers, and rainwater harvesting systems at saws.org/conservation.

Monitor Usage with MySAWS
Use the MySAWS app to track water consumption in real time, receive leak alerts from your smart meter, and participate in conservation challenges. Smart meters can detect indoor leaks before they escalate into costly problems. Stay alert to any local advisories via our boil water notices tracker.
Use Recycled Water
Access SAWS recycled water stations for landscape irrigation when available in your area. Using SAWS’s world-class recycled water supply for outdoor irrigation preserves pristine Edwards Aquifer water for drinking and cooking — a win both for your household and the aquifer’s long-term health.
Check Your Service Line & Test if Concerned
SAWS offers free service line inspections through Project Lead for homes built before 1989. If your line material is unknown, request an inspection at saws.org/lead. Private well owners should test annually. For independent testing of a broader range of contaminants, see our water quality testing guide. Contact SAWS at (210) 704-7297 for more information.
Quality News About Your Water
Get the comprehensive water quality news coverage you need with our dedicated US Water News Service. From coast to coast, we deliver in-depth reporting and expert analysis on PFAS contamination, EPA regulatory changes, infrastructure developments, and emerging water safety issues affecting communities nationwide. While mainstream media only covers the biggest stories, we provide the detailed, ongoing coverage that helps you understand the full scope of America’s water challenges.
What’s actually in your tap water? Enter your ZIP code for a full breakdown of contaminants detected in your local supply
Drinking water from a well? Check our directory here for more information
Frequently Asked Questions
Is San Antonio tap water safe to drink in 2026?
Yes — San Antonio’s water is among the safest and best-quality municipal supplies in Texas. The 2025 Water Quality Report (covering 2024 data) confirms zero violations. Lead at the 90th percentile improved dramatically to 1.6 ppb — well below the EPA’s 15 ppb action level. PFAS exposure is minimal, with only trace PFBS detected at 3.8 ppt, below the EPA’s 4 ppt MCL. One E. coli positive was detected in distribution system sampling, but this did not constitute an MCL violation.
EWG data shows 15 contaminants exceed science-based health guidelines, primarily disinfection byproducts from chlorine treatment reacting with naturally high bromide levels in the aquifer water. These remain within all federal legal limits. Sensitive individuals may wish to use a certified carbon or reverse osmosis filter for additional protection — see our filter guide.
Why does San Antonio’s water have high disinfection byproducts?
San Antonio’s exceptional aquifer water is naturally higher in bromide than most surface water sources. When chlorine is used to disinfect this water, bromide reacts with chlorine to form brominated disinfection byproducts — particularly bromoform and dibromochloromethane — at higher rates than typical surface water systems.
• Natural bromide: Comes from ancient marine deposits in the Edwards Aquifer limestone geology
• Chlorination necessity: Required to protect against microbial contamination and maintain disinfection residual throughout 9,000 miles of mains
• All within legal limits: TTHMs at 22.9 ppb (legal limit 80 ppb); HAA5s at 5.76 ppb (legal limit 60 ppb)
• Mitigation: Activated carbon or reverse osmosis filters reduce DBP exposure significantly. Letting tap water sit uncovered briefly before drinking also allows some volatile TTHMs to dissipate.
What is San Antonio doing about water sustainability?
San Antonio is a recognised global leader in water sustainability through its Vision2040 plan, which aims to achieve water neutrality — meaning all future population growth will be served through conservation and alternative supplies without increasing Edwards Aquifer withdrawals. Key achievements include:
• Recycled water leadership: SAWS operates one of the world’s largest direct recycled water systems, producing over 50 million gallons daily
• Conservation success: Per capita water use reduced by more than 40% since 1990
• Smart infrastructure: Over 600,000 smart meters with real-time leak detection deployed across the service area
• Aquifer storage and recovery: Excess water banked underground during wet years for use during droughts
• Supply diversification: Multiple aquifers, surface water sources, and regional partnerships ensure resilience against any single source failure
Are there water use restrictions in San Antonio?
San Antonio operates under a year-round water conservation ordinance with tiered restrictions based on Edwards Aquifer levels and drought conditions. Standard requirements include:
• Watering schedule: Twice per week based on address number (odd/even)
• Watering hours: Before 10 AM or after 8 PM only, to minimise evaporation
• No water waste: Running water onto streets, sidewalks, or other impervious surfaces is prohibited
• Drip irrigation exemptions apply for water-efficient delivery systems
During declared drought stages, additional mandatory restrictions apply. The Edwards Aquifer level is publicly monitored and published daily — SAWS adjusts its drought stage response as aquifer levels change. Check current stage levels and requirements at saws.org. Monitor ongoing water quality and supply alerts through our water alert news feed.
Contaminants of Concern
Chromium-6, Nitrate & Radium
Source: Chromium-6 from industrial sources and natural mineral deposits in the aquifer system; nitrate from agricultural runoff and naturally occurring organic material; radium (combined 226/228) from limestone geological formations — all naturally occurring at low levels in aquifer-sourced water.
Health Effects: Chromium-6 is carcinogenic at 0.136 ppb (6.8x EWG guideline; no federal MCL). Nitrate at 1.42 ppm (10x EWG guideline) can cause oxygen deprivation in infants and increased cancer risk. Radium at 0.34 pCi/L (6.8x EWG guideline) linked to bone cancer risk with long-term exposure.
Current Status: All three meet EPA legal limits. Reverse osmosis and ion exchange filters address chromium-6, nitrate, and radium. Compare with our Texas state overview for broader context.
Disinfection Byproducts
Source: TTHMs and haloacetic acids form when chlorine reacts with naturally occurring bromide and organic matter in San Antonio’s aquifer water. The high natural bromide content of the Edwards Aquifer drives elevated brominated DBP formation compared to most surface water systems.
Health Effects: Long-term exposure to TTHMs and HAAs is associated with increased cancer risk and adverse pregnancy outcomes. San Antonio’s levels (TTHMs 22.9 ppb; HAA5s 5.76 ppb) remain within EPA legal limits (80 ppb and 60 ppb respectively) but exceed EWG’s stricter guidelines substantially.
Filter recommendation: Activated carbon filters are effective and lower cost; reverse osmosis provides the broadest protection across all 15 EWG-flagged contaminants. See our water filter solutions guide for certified options.
Please read – our information
The information presented on cleanairandwater.net is compiled from official water quality reports, trusted news sources, government websites, and public health resources. While we strive for accuracy and thoroughness in our presentations, we are not scientists, engineers, or qualified water quality professionals.
Our mission is to present water quality information in an accessible, real-world format that helps people understand what’s in their water and make informed decisions about their health and safety. We believe that complex environmental information should be available to everyone in a format that’s easy to understand.
We make every effort to ensure our content is current and accurate, but we cannot guarantee that all information is complete or error-free. This website should not replace official communications from your local water utility or health department. We always recommend consulting official sources for the most up-to-date information regarding your specific water system.
Clean Air and Water is not liable for any unintentional errors, omissions, or outdated information. The content on this site is provided for informational purposes only and should not be considered professional advice.