Washington DC Water Quality at a Glance
significant concerns
Is Washington DC Water Safe to Drink?
EPA Compliant, But Multiple Health Guideline Exceedances – DC water meets federal standards but contains 37 different contaminants, 13 exceeding health guidelines. Key concerns include disinfection byproducts at extreme levels (HAA9 at 707x safe levels), arsenic at 27x guidelines, chromium-6 at 4.3x safe levels, and radium at 7.6x guidelines. Water sourced from Potomac River via Washington Aqueduct is treated but forms dangerous byproducts during chlorination process.
⚠️ Key Concerns for Washington DC Residents
- Disinfection Byproducts: HAA9 at 707x safe levels, TTHMs at 310x guidelines – formed when chlorine reacts with organic matter
- Carcinogenic Chemicals: Arsenic at 27x guidelines, chromium-6 at 4.3x safe levels, radium at 7.6x guidelines – all linked to cancer
- PFAS “Forever Chemicals”: Multiple PFAS compounds detected affecting all 600K+ residents served by DC Water
- Agricultural/Industrial Contamination: Nitrates at 14x guidelines, herbicides like atrazine and 2,4-D from runoff and industrial sources
Read the full report below for detailed analysis, city-specific data, and actionable recommendations for Washington DC residents.
Washington DC (District of Columbia) – Water Quality Report 2025: PFAS Testing, Infrastructure Concerns & Safety across your city
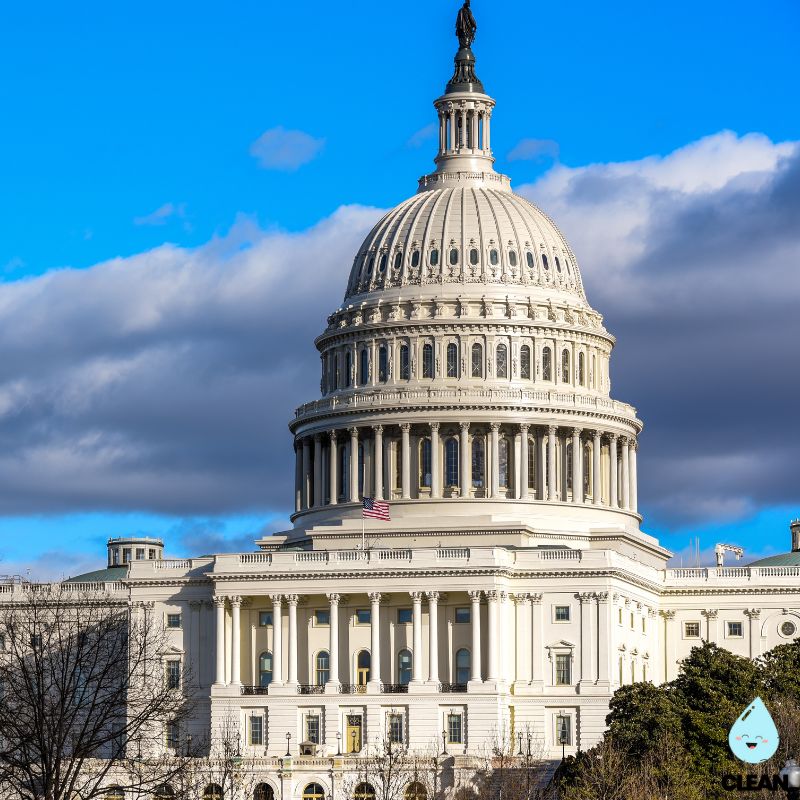
Washington DC’s drinking water comes from the Potomac River and meets all federal compliance standards as of 2024. However, the city faces ongoing challenges with lead service lines (over 41,000 still need replacement) and certain contaminants that exceed health guidelines recommended by independent scientists, though they meet current federal limits. DC Water has implemented a $1.5 billion Lead Free DC program with the goal of replacing all lead pipes by 2030, with about 4,300 lines replaced since the program began in 2019.
Washington DC Water Quality: Current Status (2024-2025)
- Water Source: All water in Washington DC comes from the Potomac River near Great Falls, treated at the Dalecarlia Reservoir by the Washington Aqueduct (a division of the U.S. Army Corps of Engineers), and then sold to DC Water. DC Water
- Distribution System: Water is pumped to reservoirs throughout the city, which are located at different elevations to supply water to points below them, flowing downhill via gravity to homes and businesses. DC Water
- Monitoring: DC Water’s monitoring program tests more than 40,000 samples annually from various sources across the District, exceeding requirements to ensure clean and reliable water delivery. DC Water
Lead Service Line Status
- Total Lead Lines: DC Water estimates the District has more than 41,000 service lines with lead or galvanized-iron pipe that need replacement with copper pipe. DC Water As of 2023, DC Water estimated 41,157 service lines will need to be replaced through the Lead Free DC program. WUSA9
- Replacement Progress: As of 2023, Lead Free DC has replaced 4,287 lead service lines with copper pipes since 2019. WUSA9
- Replacement Goal: DC Water has released a plan to replace all lead pipelines by 2030, with an estimated cost of $1.5 billion, a significant increase from the original estimate of $300-500 million. WTOP News
- Replacement Programs: The District allocated $8.5 million to DC Water in FY22 to cover the complete cost of lead water service pipe replacement on private property when DC Water replaces the public portion during capital improvement projects. DC DOEE
Water Quality Testing Results
- Compliance Status: For the latest quarter assessed by the EPA (April-June 2024), DC’s tap water was in compliance with federal health-based drinking water standards. EWG
- Contaminant Concerns: According to the Environmental Working Group (EWG), test results through 2024 showed 37 contaminants in DC’s water, with 13 at levels above EWG’s health-based guidelines. EWG
- Key Contaminants: Key contaminants of concern include disinfection byproducts (HAA9 at 707x guidelines, TTHMs at 310x guidelines), arsenic at 27x guidelines, chromium-6 at 4.3x guidelines, and radium at 7.6x guidelines. EWG
Health Concerns and Context
- Lead Exposure History: In 2016, researcher Marc Edwards estimated that Washington DC’s earlier lead crisis was “20 to 30 times worse” than the Flint water crisis, according to testimony cited by The Washington Post. Wikipedia
- Current PFAS Status: DC Water’s current PFAS test results from samples collected over 2021-2025 are below the EPA’s new Maximum Contaminant Levels and Hazard Index, though multiple PFAS compounds are still detected. DC Water
- Health Guidelines vs. Regulations: Federal compliance doesn’t guarantee water meets latest health guidelines, as legal limits for contaminants haven’t been updated in almost 20 years. EWG
Ongoing Monitoring and Resources
Annual Reporting: The District of Columbia publishes an Integrated Report that provides information on the city’s water quality, combining reporting requirements of the Clean Water Act. DC DOEE
Service Line Map: DC Water has created an interactive map showing residents which pipe lines are made of lead or other potentially dangerous metals, with information gathered from historical data and inspections. DC Water
Water Testing: Residents can call DC Water at 202-787-4044 to request a water test kit if concerned about lead in their tap water. DC DOEE
Quality News About Your Water
Get the comprehensive water quality news coverage you need with our dedicated US Water News Service. From coast to coast, we deliver in-depth reporting and expert analysis on PFAS contamination, EPA regulatory changes, infrastructure developments, and emerging water safety issues affecting communities nationwide. While mainstream media only covers the biggest stories, we provide the detailed, ongoing coverage that helps you understand the full scope of America’s water challenges. Whether you’re a concerned citizen, water professional, or community leader, our daily updates and analytical insights keep you informed about the issues that matter most to public health and environmental safety.
Frequently Asked Questions
Is Washington DC’s tap water safe to drink?
The water meets all federal standards enforced by the EPA and is considered safe to drink. However, 13 contaminants exceed stricter health guidelines set by independent scientists, including disinfection byproducts and carcinogens. Lead can still leach from the 41,000+ remaining lead service lines. Using an NSF-certified filter (Standard 53) provides extra protection, especially for households with children, pregnant women, or elderly residents.
How do I know if my home has a lead service line?
DC Water maintains an interactive map of service line materials throughout the city. Visit geo.dcwater.com/Lead and enter your address. The map shows whether your public and private service lines are made of lead, copper, or other materials. If information is unavailable or you’re unsure, you can request an inspection by calling DC Water at 202-787-4044.
What contaminants are of concern in DC’s water?
While DC’s water meets federal standards, the Environmental Working Group (EWG) has identified 13 contaminants that exceed their recommended health guidelines, including disinfection byproducts (HAA9 at 707x guidelines, TTHMs at 310x guidelines), arsenic at 27x guidelines, chromium-6 at 4.3x guidelines, and radium at 7.6x guidelines. These contaminants may pose long-term health concerns despite being below federal legal limits, which environmental advocates argue haven’t been updated to reflect current science.
How much will it cost to replace my lead service line?
The cost of replacing lead service lines on private property typically ranges from $2,000-$3,000. However, DC has established funding programs to assist homeowners. If DC Water is already replacing public lines in your area, replacement of your private line may be covered at no cost. Other assistance programs are available for eligible residents outside of scheduled capital improvement projects.
Contaminants of Concern
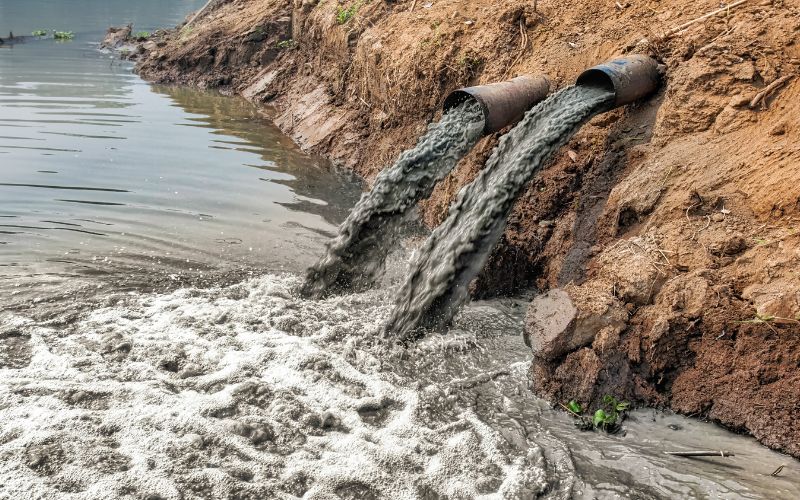
Chromium (including Hexavalent Chromium)
Primary source: Natural deposits and industrial pollution
Health concerns: Known carcinogen, particularly hexavalent chromium (made famous by the Erin Brockovich case)
Status: Chromium-6 levels in Washington DC water have exceeded Environmental Working Group’s recommended safety levels by 4.3 times
Lead
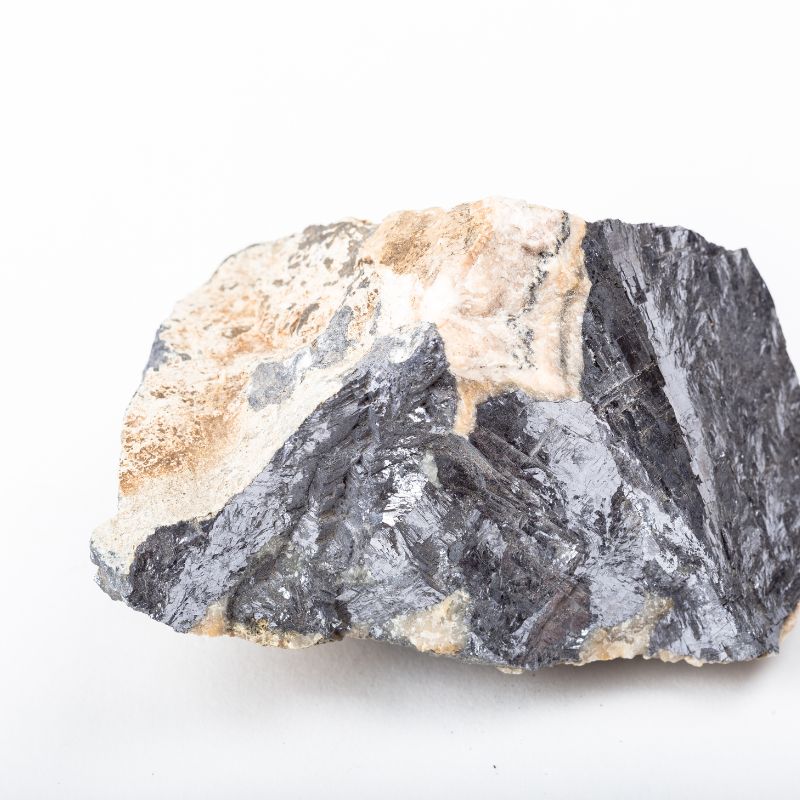
Primary source: Lead service lines and old plumbing fixtures
Health concerns: Developmental delays in children, learning difficulties, kidney problems, high blood pressure
Status: While overall levels meet federal standards, homes with lead service lines remain at risk. Over 41,000 lead service lines in DC have not been replaced and those remaining may cause contamination issues for residents
Please read – our information
The information presented on cleanairandwater.net is compiled from official water quality reports, trusted news sources, government websites, and public health resources. While we strive for accuracy and thoroughness in our presentations, we are not scientists, engineers, or qualified water quality professionals.
Our mission is to present water quality information in an accessible, real-world format that helps people understand what’s in their water and make informed decisions about their health and safety. We believe that complex environmental information should be available to everyone in a format that’s easy to understand.
We make every effort to ensure our content is current and accurate, but we cannot guarantee that all information is complete or error-free. This website should not replace official communications from your local water utility or health department. We always recommend consulting official sources for the most up-to-date information regarding your specific water system.
Clean Air and Water is not liable for any unintentional errors, omissions, or outdated information. The content on this site is provided for informational purposes only and should not be considered professional advice.
