What We Do — and Why It Matters
Clean Air and Water is an independent research publication dedicated to one question: what is actually in America’s drinking water, and what does it mean for the people drinking it?
The data exists. The EPA publishes violation records. Utilities file annual Consumer Confidence Reports. State environmental agencies monitor contamination. But this information is scattered across hundreds of databases, written in technical language, and almost impossible for an ordinary person to find, let alone act on.
We built this platform to change that. Since 2022, we have systematically compiled, verified, and translated water quality data into clear, honest assessments for over 175 U.S. cities and every state in the country — fully refreshed for 2026. Every page cites its sources. Every grade can be checked. Nothing is fabricated, and no utility or manufacturer has ever paid to influence our findings.
We also operate the U.S. Boil Water Notice Tracker — one of the only live, national databases of active boil water advisories, updated automatically around the clock.

Our Methodology
Every water quality report we publish follows a consistent research process. Here is exactly how we produce our assessments:
Primary Source Collection
We retrieve the most recent Consumer Confidence Report directly from the utility, cross-referenced against EPA SDWIS violation records and state environmental agency databases.
Contaminant Verification
Detected contaminant levels are verified against both current EPA Maximum Contaminant Levels (MCLs) and health-based guidelines from the Environmental Working Group (EWG) and peer-reviewed literature.
Infrastructure Assessment
We review reported lead service line replacement progress, known infrastructure vulnerabilities, boil water notice history, and any EPA enforcement actions or consent orders on file.
PFAS & Emerging Contaminant Review
We check UCMR 5 monitoring results, state-level PFAS testing data, and independent testing reports to identify emerging contamination risks not yet captured in standard CCR reporting.
Grade Assignment
An overall A–F grade is assigned based on violation history, contaminant levels relative to EPA limits, infrastructure risk, and PFAS status. Grades are reviewed and updated annually, or when significant new data is published.
Annual Refresh
All city and state pages were fully refreshed in 2026 with current data. Each page displays its last-modified date. We do not allow pages to carry stale data — outdated assessments are preferable to wrong ones.
Primary Data Sources
Every assessment we publish draws exclusively from verified government and institutional sources. We aggregate, verify, and translate this data — we never fabricate ratings or accept payment to influence them.
Our Editorial Principles

Data Over Opinion
Every claim we make is anchored to a verifiable source. We do not speculate, extrapolate beyond the data, or publish findings we cannot back with primary documentation. When data is uncertain or contested, we say so.
Editorial Independence
We are not affiliated with, funded by, or editorially influenced by any water utility, government agency, or filter manufacturer. Where affiliate relationships exist on product recommendation pages, they are clearly disclosed. They never affect our research findings.

Accessibility of Information
Government water quality data is technically public — but practically inaccessible to most people. We translate dense regulatory language into plain English so that any family, regardless of scientific background, can understand what is in their water and what to do about it.
Frequently Asked Questions
How do you collect your water quality data?
We retrieve Consumer Confidence Reports directly from utilities, cross-referenced against EPA SDWIS violation records, state environmental agency databases, and UCMR 5 PFAS monitoring data. All sources are cited within each city and state report.
How often is your data updated?
All 175+ city and state pages were fully refreshed in 2026. Pages are updated whenever new Consumer Confidence Reports or significant EPA violation records are published. Each page displays its last-modified date. Our boil water tracker is updated automatically in real time.
What do your water quality grades mean?
Our A–F grades combine EPA violation history, detected contaminant levels compared to both legal limits and current health guidelines, PFAS status, and infrastructure risk into a single accessibility score. Detailed breakdowns appear on every city page. Grades reflect overall safety — not a guarantee the water is free of all contaminants.
Can journalists use your data?
Yes. Our research is available for citation, reference, and republication with attribution to Clean Air and Water (cleanairandwater.net). For data requests, specific findings, or press enquiries, please contact us. We aim to respond to all journalist enquiries within 24 hours.
What areas do you cover?
We cover 175+ U.S. cities and all 50 states, plus Washington D.C. Major cities include New York City, Los Angeles, Chicago, and Houston. Use our ZIP code checker or the full directory to find your location.
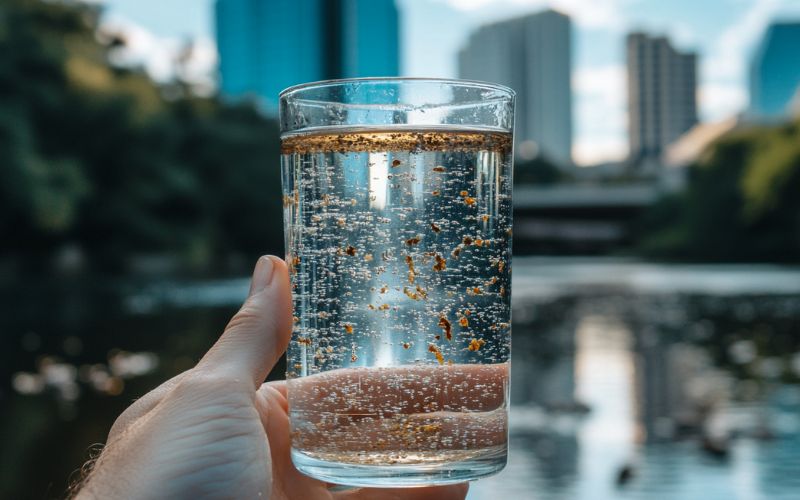
Is U.S. tap water safe to drink?
Most U.S. tap water meets EPA legal standards — but “legal” does not always mean “safe.” Hundreds of contaminants have no enforceable federal limit despite documented health risks. PFAS, for example, is now confirmed in water supplies serving 176 million Americans, with compliance not required until 2031. Our reports help you understand the full picture for your specific location.
Explore Water Quality by City or State
We cover 175+ cities and all 50 states. Select a location below to read the full water quality report, or use the ZIP code checker for your specific address.
Quality News About Your Water
Get the comprehensive water quality news coverage you need with our dedicated US Water News Service. From coast to coast, we deliver in-depth reporting and expert analysis on PFAS contamination, EPA regulatory changes, infrastructure developments, and emerging water safety issues affecting communities nationwide. While mainstream media only covers the biggest stories, we provide the detailed, ongoing coverage that helps you understand the full scope of America’s water challenges.
What’s actually in your tap water? Enter your ZIP code for a full breakdown of contaminants detected in your local supply
Drinking water from a well? Check our directory here for more information